import pandas as pd
import numpy as np
import geopandas as gpd
import geoplot as gplt
import matplotlib.pyplot as plt
from geoplot import polyplot
from pythainlp.tokenize import word_tokenize, syllable_tokenize
Data structure
- name: target region name
- geometry: spatial column
- *: parent region name, e.g. in “district” dataset it would have a “province” column
Dissolving dataset in case you have multiple region level in the same file
## assuming you have a district dataset and want to dissolve to province only
district_filename = "FILE_PATH_HERE"

gdf = gpd.read_file(district_filename)

used_columns = ['province',
                'district',]

gdf = gdf.rename(columns={'prov_namt'.upper(): 'province', # change to dummy
                         'amp_namt'.upper():'district', })

gdf = gdf[used_columns+['geometry']]

## desired data 🛎🛎🛎 please do create a datasest with outermost region, so we can use it as boundary for visualization
province = gdf.dissolve(by='province')
province = province.reset_index()\
                .rename(columns={'province': 'name'})\
                .drop(columns='district')
province
.dataframe tbody tr th {
    vertical-align: top;
}

.dataframe thead th {
    text-align: right;
}
## declare dummy variable so it can be reused with other region type
df = province
EDA: tokenize region name. Use other tokenizer for your target language
def tokenize(unique_region_values):
    """
    input: unique values of region type
    return: dataframe with token columns
    """

    temp = pd.DataFrame()
    temp['name'] = pd.Series(unique_region_values)
    temp['token'] = temp['name'].apply(lambda x: syllable_tokenize(x))

    # Thai doesn't use space to separate words, so it's a bit wonky
    # when I tell it to do such, that's why I need to see the results
    # manually, and in some cases it may "clip" a token
    temp['token_1-1'] = temp.token.str[0]
    temp['token_1-2'] = temp.token.str[1]
    temp['token_1_full'] = temp['token_1-1'] + temp['token_1-2']

    temp['token_2-1'] = temp.token.str[-2]
    temp['token_2-2'] = temp.token.str[-1]
    temp['token_2_full'] = temp['token_2-1'] + temp['token_2-2']

    return temp
Don’t forget to look through the results and pick tokens you think are “correct”
tokenize(df.name.unique())
.dataframe tbody tr th {
    vertical-align: top;
}

.dataframe thead th {
    text-align: right;
}
Tokenize with selected slugs
## replace with your slugs here
slugs = ['นคร', 'สุ', 'สมุทร', 'ธานี', 'นคร']
slugs = sorted(list(set(slugs)))
slugs = slugs[::-1] # for longest matching

## get prefix and suffix
def get_slug_1(x):
    for i in slugs:
        if (x.startswith(i)):
            return i

def get_slug_2(x):
    for i in slugs:
        if (x.endswith(i)):
            return i
df['prefix'] = df['name'].apply(lambda x: get_slug_1(x))
df['suffix'] = df['name'].apply(lambda x: get_slug_2(x))

df
.dataframe tbody tr th {
    vertical-align: top;
}

.dataframe thead th {
    text-align: right;
}
Viz prep
## make total_bound (background outline)
## and extend (so the canvas would center at the same point)
## also, remember the PROVINCE dataset from the start? we're going to use that

province['class'] = 'class' # a dummy column so it would dissolve the whole dataset
boundary = province.dissolve(by='class')
extent = boundary.total_bounds
## set font (default matplotlib font can't render Thai)
plt.rcParams["font.family"] = "Tahoma"
Cleaning it up
There are some degree of Pali-Sanskrit influence in Thai, in which the word order is different, so it is possible for a certain *fix to appear as either prefix or suffix. it’s like repeat and dore (for redo)
## ⛩⛩⛩ rerun from this cell onward if you want to change *fix ⛩⛩⛩
## filter null *fix
_fix_column = 'suffix' # ⛩⛩⛩ change here ⛩⛩⛩
df_temp = df
df_temp = df_temp[df_temp[_fix_column].notnull()]

## get count
df_temp['{}_count'.format(_fix_column)] = df_temp[_fix_column].map(df_temp[_fix_column]\
                                            .value_counts()\
                                            .to_dict())
## at the largest region level it won't be much, but at a smaller level like subdistrict
## having a single *fix for the entire dataset can happen, hence we should filter it out

## filter for a *fix you want to visualize
viz_categ_count_column = '{}_count'.format(_fix_column)

## ⛩⛩⛩ use the second line if you want to set the threshold with median ⛩⛩⛩
threshold = 0
## threshold = df_temp[viz_categ_count_column].median()

df_temp = df_temp[df_temp[viz_categ_count_column] >= threshold]
df_temp
.dataframe tbody tr th {
    vertical-align: top;
}

.dataframe thead th {
    text-align: right;
}
Viz
import os

key_column = _fix_column
key_name = 'province' # ⛩⛩⛩ set region type here #
key_count_column = '{}_count'.format(key_column)

out_dir = 'plot/{}_{}'.format(key_name, key_column)
os.makedirs(out_dir, exist_ok=True)

gdf = df_temp
for key in gdf[key_column].unique():
    ax = gplt.polyplot(boundary, figsize=(10, 15))

    query = gdf[gdf[key_column]==key]
    total_records = str(int(query[key_count_column].tolist()[0]))

    gplt.polyplot(query, ax=ax, extent=extent,edgecolor='black',
                        facecolor='green')

    plt.title('{}: {} records'.format(key, total_records))

    plt.savefig('{}/{}_{}.png'.format(out_dir, str(total_records).zfill(3), key))
##     break
Output structure
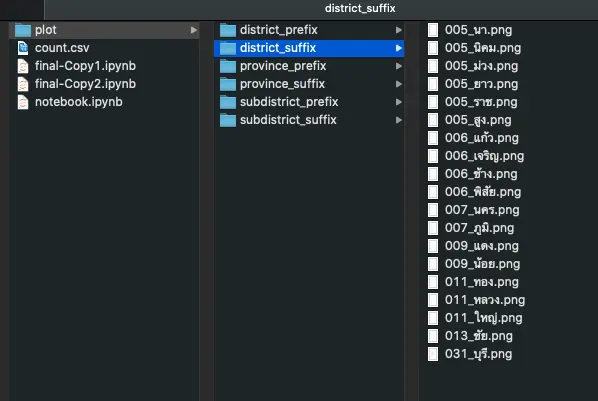
Some interesting outputs (at subdistrict level)
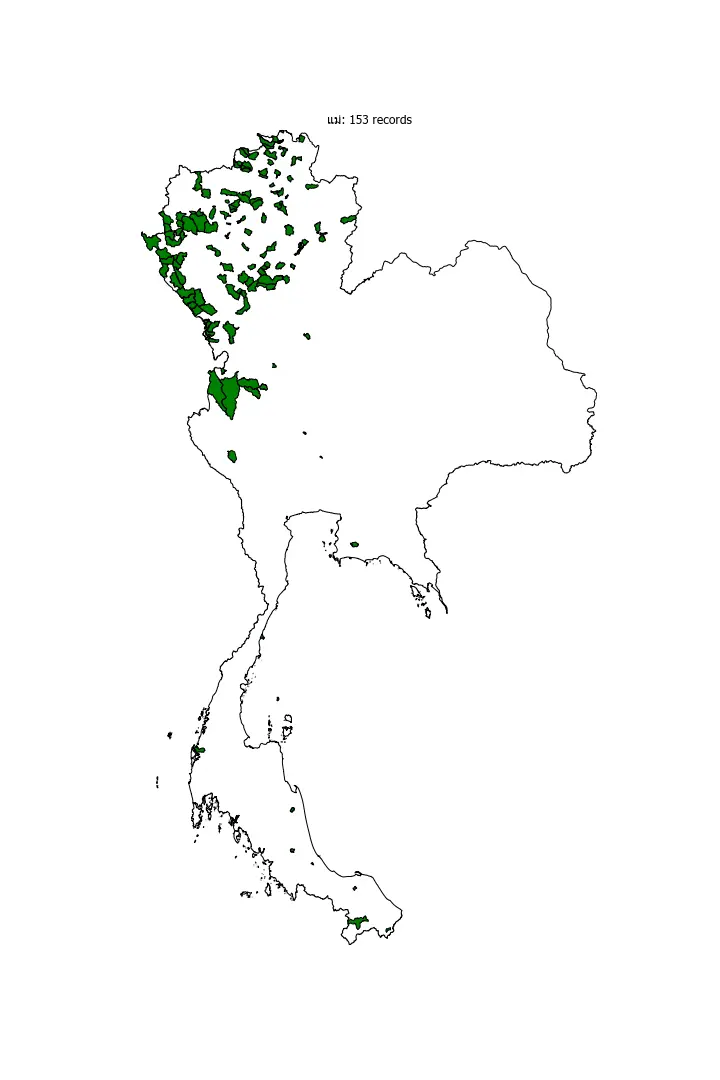
Northern region
You can see that the prefix “แม่” concentrates around the northern region.
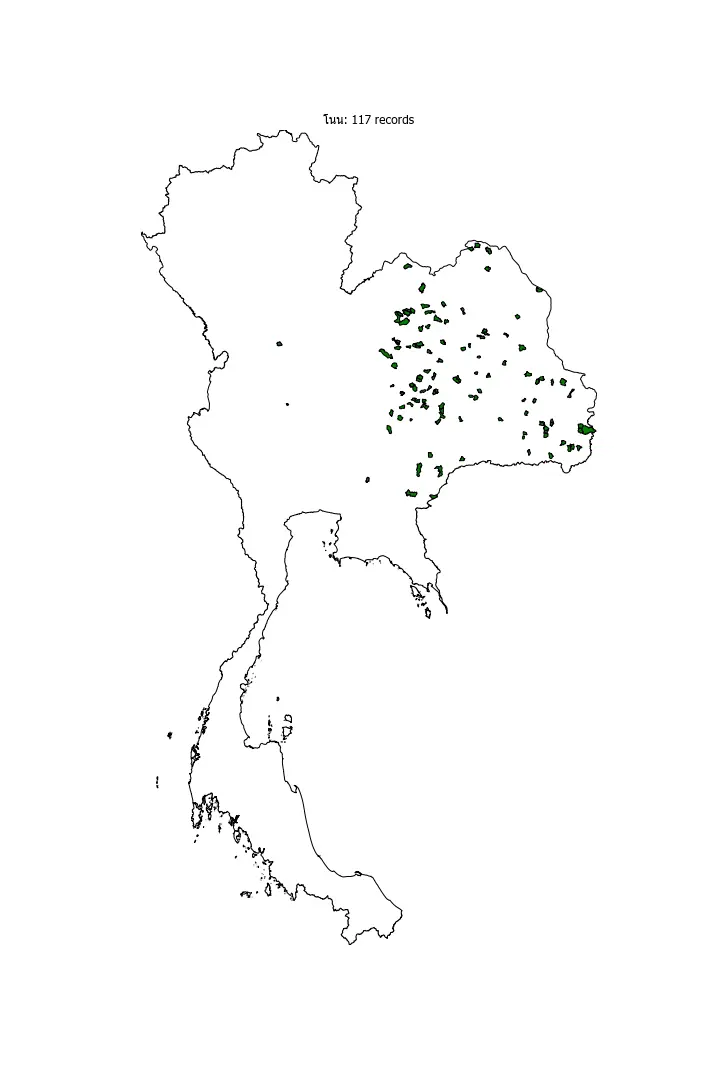
Eastern region
“โนน” seems to be specific to the eastern seeing it’s clustered around the eastern part of the country.
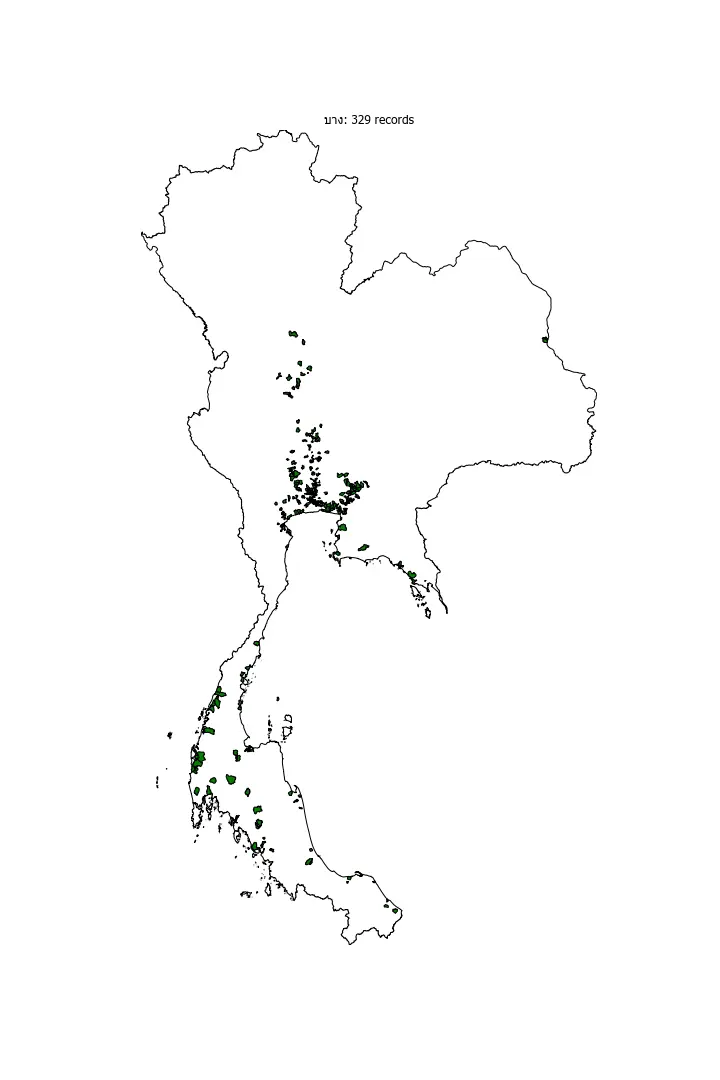
Multi-region
As expected, “บาง” is clustered around the central region, no surprise here since the old name of Thailand’s capital (it’s located in the central region) is “บางกอก.” But you can see that it’s clustered around the southern parts as well.